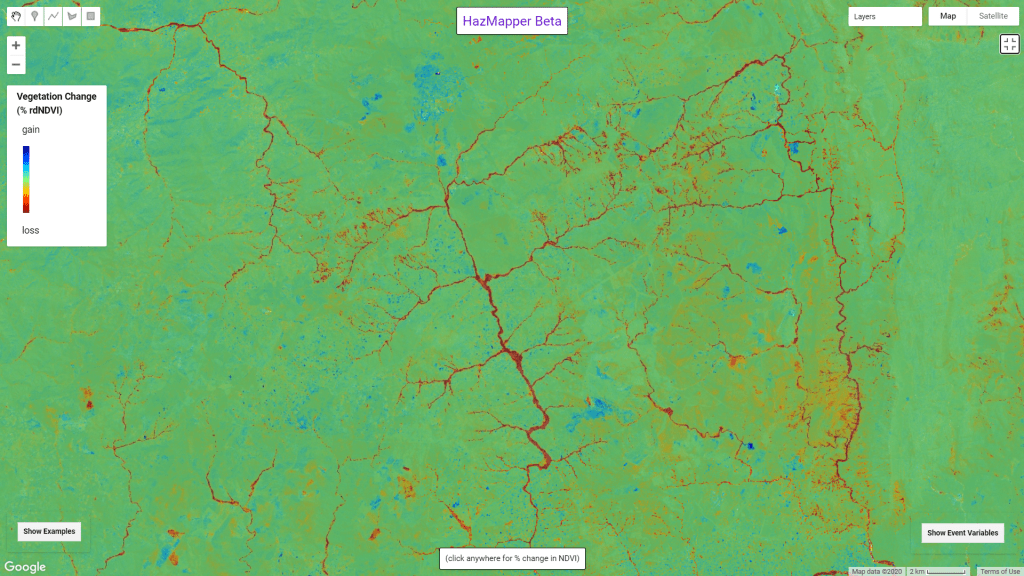
Mass Wasting induced by Cyclone Idai, March 2019, Zimbabwe/Mozambique border region
Welcome to the HazMapper Learn Page. This page is intended to hold helpful posts for learning to use HazMapper to its fullest extent. Also check out our Help/Q&A page for other tips.
Your First Analysis in HazMapper
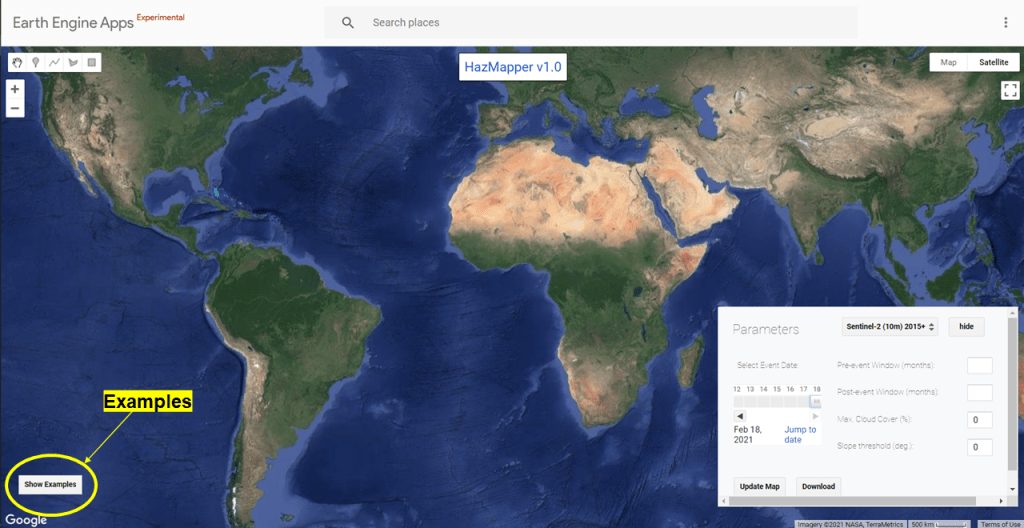
The easiest way to get started in HazMapper is using the “Examples” panel in the lower left of the app:
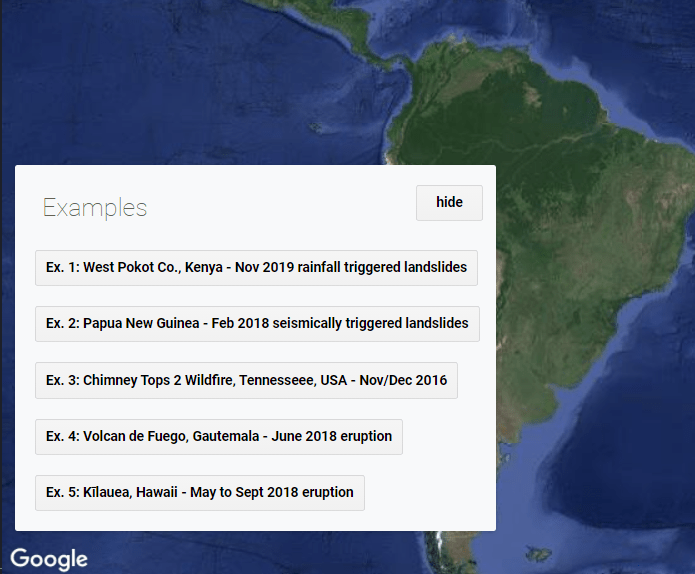
This will bring up a list of 5 example events we’ve evaluated in HazMapper. We’ve already selected the appropriate variables for analyzing these events. Clicking one of the links will set the event parameters and zoom you to the event. Just sit back and wait for everything to load.
In this post, we’ll click on the first link, zooming us to Kenya.
The following GIF shows me clicking on the Kenya example and watching HazMapper perform the analysis. You’ll see me navigate to the upper right “Layers” pane where we can modify transparency with a slider or turn layers on or off. Additionally, we can change the base map from the default satellite view to a Google terrain map:
Next we can digitize some of the debris flows using the digitization tools in the upper left. After this, we can click the “Download” link in the parameters window and get a KML of our “digitzed geometries” which include the debris flow initiation points and a drainage of interest.
Finally, opening this KML file in Google Earth allows visualization of the area:
During the data download, you can download the pre-event and post-event images or the vegetation difference image as TIF files for use in a GIS. Share these files with a colleague or use them in more advanced analysis.
Looking for more?
Here is a 15-minute YouTube video about the functionality and utility of HazMapper that was presented at the 2020 GSA Connects Online Meeting.
