Very excited to announce we have opened HazMapper for the masses! We have been beta-testing the app and have had several researchers using the platform, including a class exercise in which 30 students used it to map landslides in the Philippines. For technical information about HazMapper and additional details on the app’s functionality and limitations, please read our manuscript (in review): https://nhess.copernicus.org/preprints/nhess-2020-108/.
North Carolina State University licenses the source code as a research-only license. Our intent through HazMapper is to democratize spatial data analysis of large datasets. You can use it for research projects, scientific interest, or a public safety project. Use HazMapper to check out a natural disaster, monitor logging operations, or check the growth-cycle status of chili pepper fields in New Mexico, among many other applications.
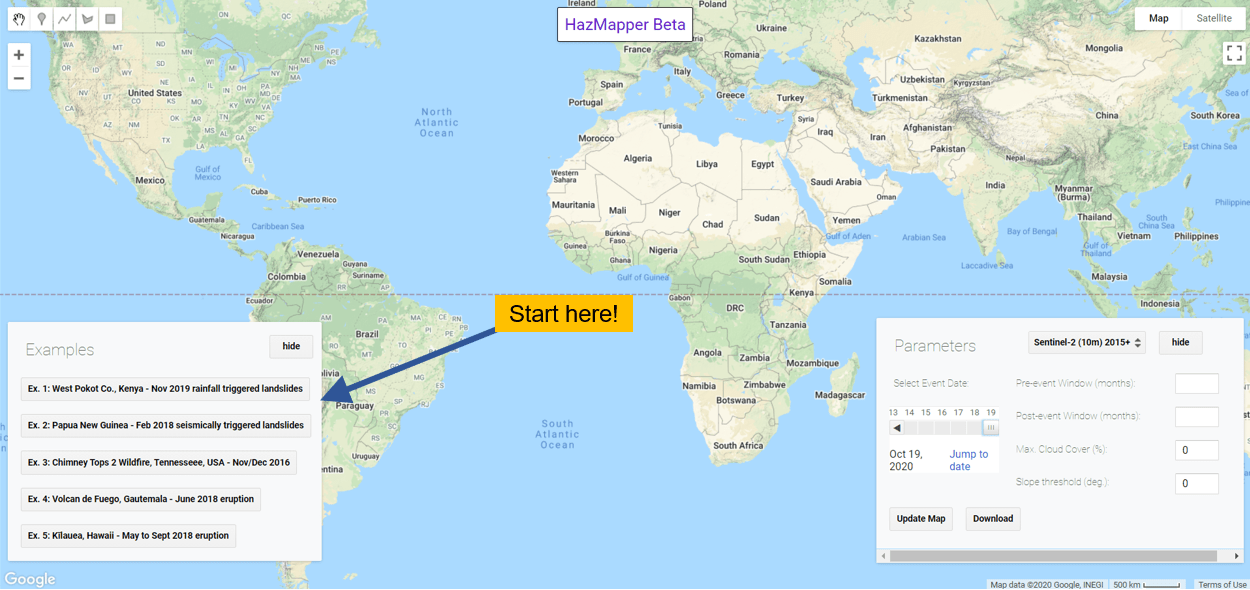
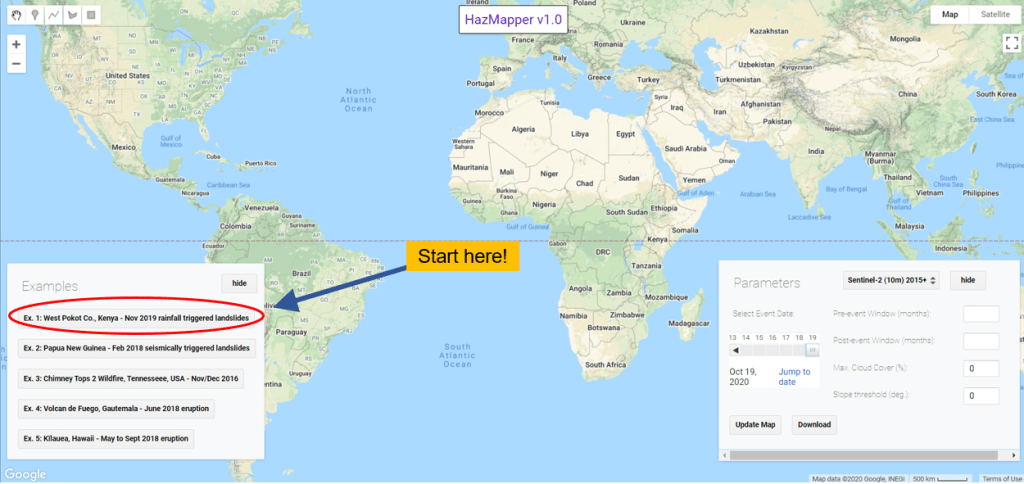
Getting started (click here for HazMapper)
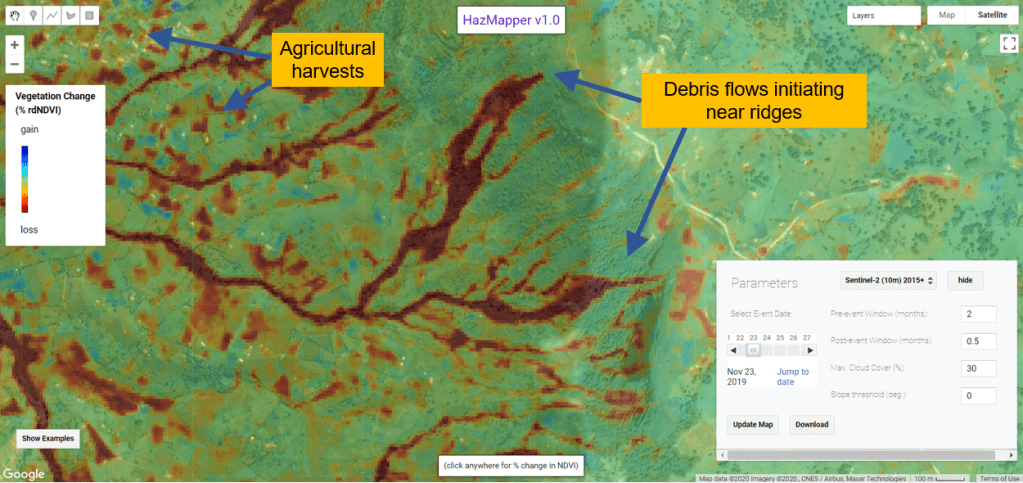
When HazMapper first launches, it takes a few seconds (~30) to load up the webpage. Expect a short delay. We have included five examples to get you started. Click on one of the listed examples first, and the app will start processing data and zoom to the spatial extent for the event. For this example, let us explore a debris flow event that happened in West Pokot County, Kenya in 2019 (Ex. 1 in the Show Examples pane).
This will load 4 layers, the rdNDVI layer, the greenest post-event image, greenest pre-event image, and a SRTM-derived hillshade. Note the URL gets updated too. You can share this URL with others and it will set their event parameters and bring them to your analysis.
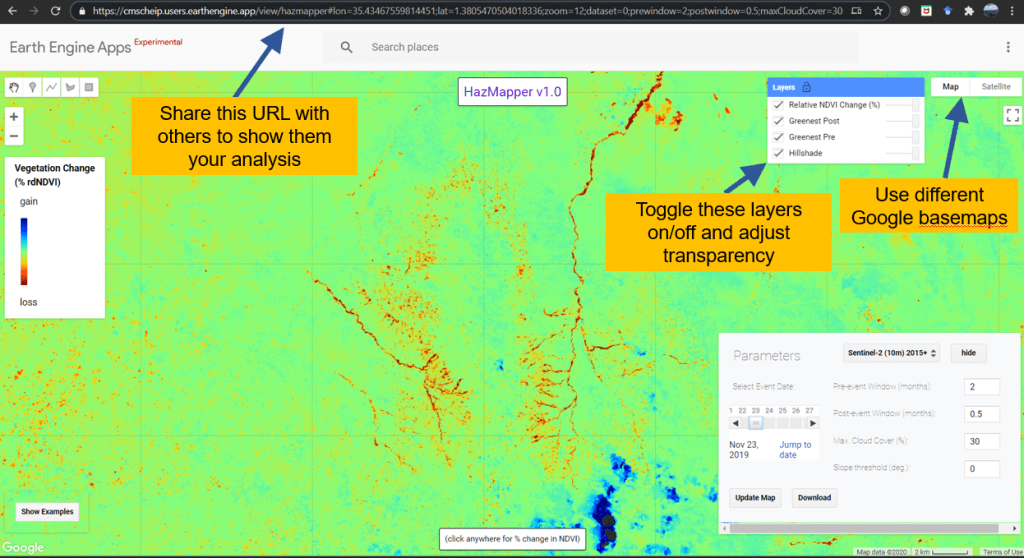
Now we have a decent look at where the debris flows were. By toggling some layers off, adjusting transparency, and zooming in a bit, we can make this even more clear.
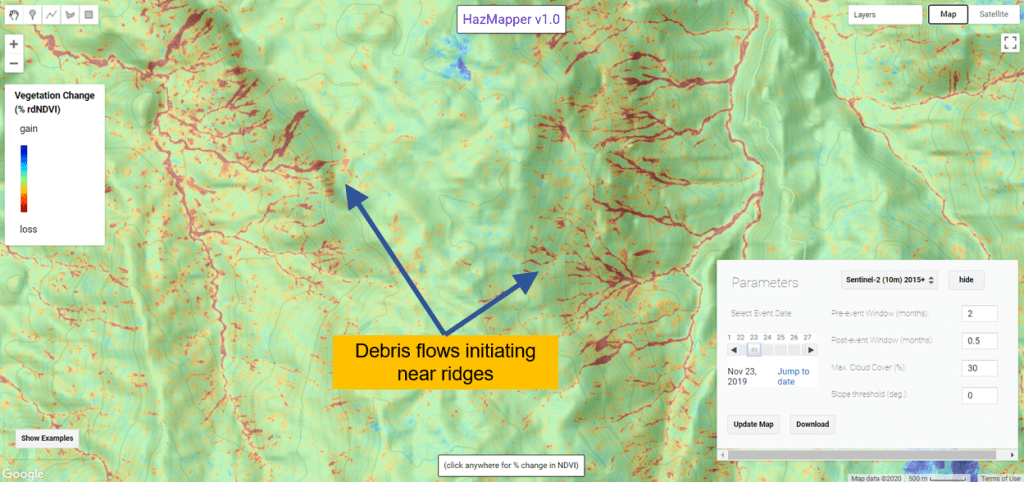
Sometimes the satellite imagery is really helpful too, let’s zoom in a bit further and change the basemap.
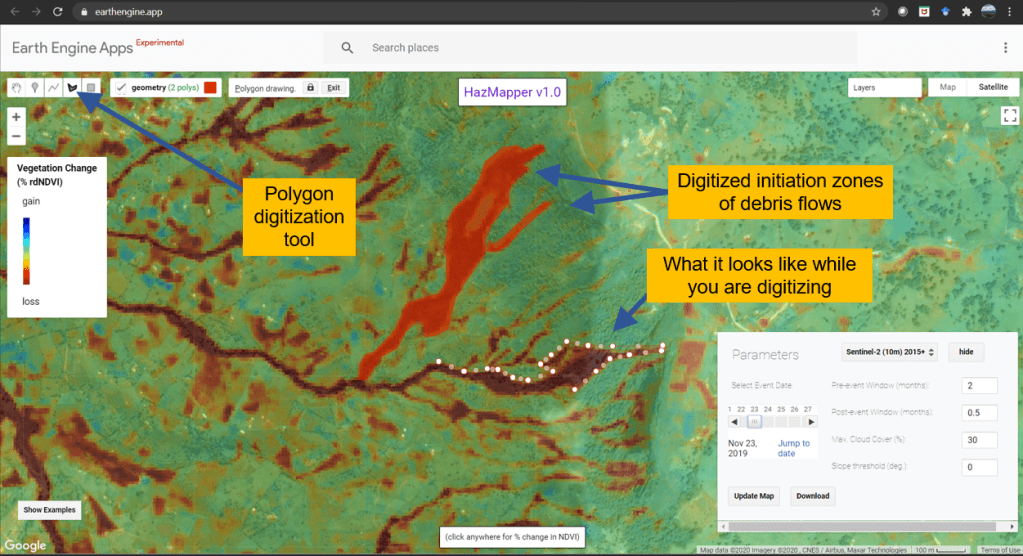
Next, we can digitize a couple of the debris flows using Google’s built in digitization tools.
Use the “Download” button in the lower right to export these digitized features.
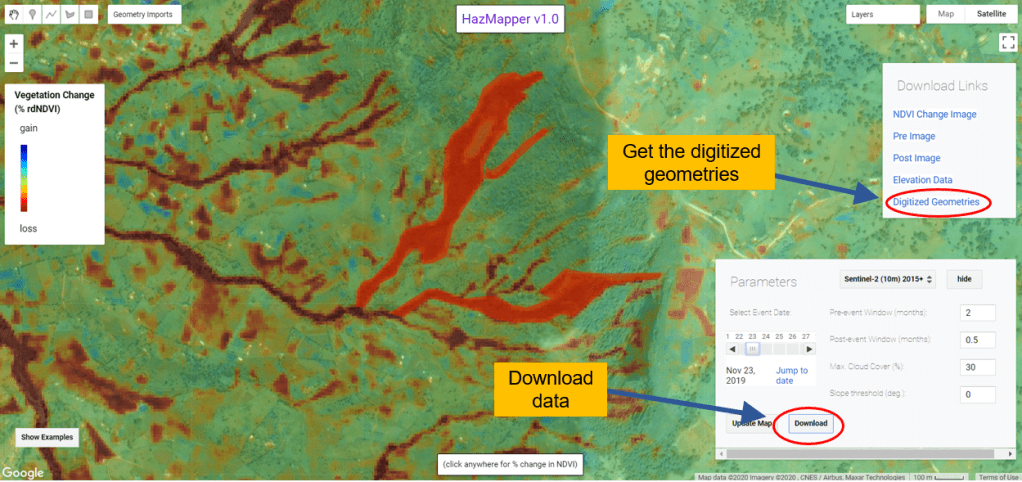
This will bring up a standard download dialog, allowing the user to save the data to their PC. Once saved, open it up in Google Earth! A note of caution, however, if the download button does not appear to work, it may be that your area of interest is too large. Google Earth Engine imposes download file size limits. Zoom in to a smaller area and try again. This should help.

What can go wrong? FAQ.
We’ve done a lot of work building HazMapper, but of course there are still a few bugs! Some of the most common problems are generally a matter of scale. Even Google Earth Engine has limits, and continental scale analysis can be really challenging.
Long time to load
If the results are taking a long time to load (more than 1-2 minutes), you probably are trying to analyze too large of an area. Try zooming in and see if that helps. Maybe you’re also using a decade of data for analysis. Try tightening up your pre- and post-event windows and run the analysis again. Maybe a combination of the two.
Similarly, if the download data dialogs don’t come up or when you click them they don’t give you a file download, well, you guessed it. Too big of an area! Zoom in and try again.
Event dates
There is also a known bug with event dates changing when you change datasets. If this happens, try reloading the page or reloading HazMapper and selecting your dataset right away instead of changing datasets during analysis.
Noise, noise, noise
If you have a lot of noise in the result and it’s not as clean as you’d like, several things could be happening. Remember, we use the relative difference in normalized difference vegetation index (rdNDVI). This is solely a vegetation based metric. HazMapper is best suited for use in vegetated areas and may have a lot of noise in snowy or arid environments.
Another possibility is you may have a lot of cloud cover in the pre- and post-event windows you’ve selected. Toggle the rdNDVI layer off and inspect the pre- and post-event imagery. Does it look clear? If not, you may want to expand your pre- or post-event windows to collect more cloud-free data for analysis.
Other resources
Many more details are available in our NHESS manuscript (in review). Please check it out here: https://nhess.copernicus.org/preprints/nhess-2020-108/.
We’ll be building out the https:\\hazmapper.org website over the coming months, including a FAQ page and a Learn page.
Built for the community
We’re building HazMapper for the community and that means you! We’re interested in what you find and hope the tool is useful. There are already plans underway for HazMapper 2.0. We look forward to seeing what we can do with the big data revolution that Earth Engine has brought to the remote sensing community. Please send your ideas along and if you want to get involved and help with the project, send an email! Have fun exploring! Corey & Karl.
