The HazMapper project was first envisioned and designed for locating mass wasting events in vegetated environments. We quickly realized that the Google Earth Engine application that we built can be used as a multi-hazard platform, as exemplified by the tornado-track example in our first post. Here we discuss the capabilities of HazMapper for its initial intended purpose, the location and characterization of mass wasting events, including landslides, debris flows, and down-stream flooding resulting from heavy precipitation events.
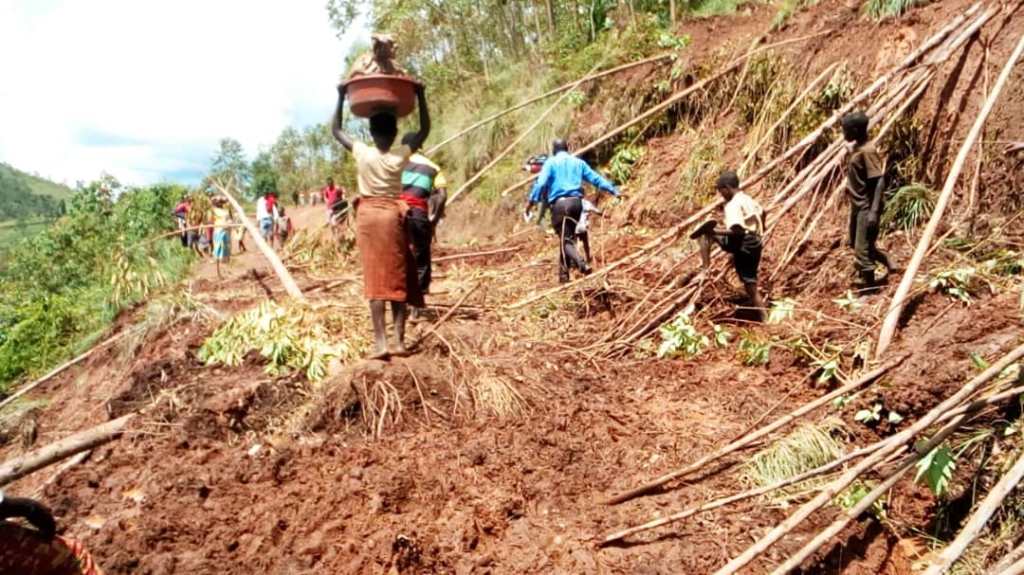
We first learned of widespread rainfall-triggered mass wasting in Burundi from Dave Petley’s AGU Landslide Blog that he posted on 13 January 2020. In early December 2019, heavy rains fell over the northwestern Cibitoke Province of Burundi. These rains triggered landslides, many initiating high on hillslopes as shallow-rapid soil or weathered bedrock slides that transitioned into deadly debris flows once channelized. Further downstream along the main rivers, significant flooding occurred. An assessment report published on Reliefweb seven days after the December 4-5 event indicate that there were at least 45 casualties, destruction of 206 homes, and significant damage to local infrastructure. ABP posted some photos of the aftermath of the event in a pair of Twitter posts on 5 December (post 1 and post 2) .
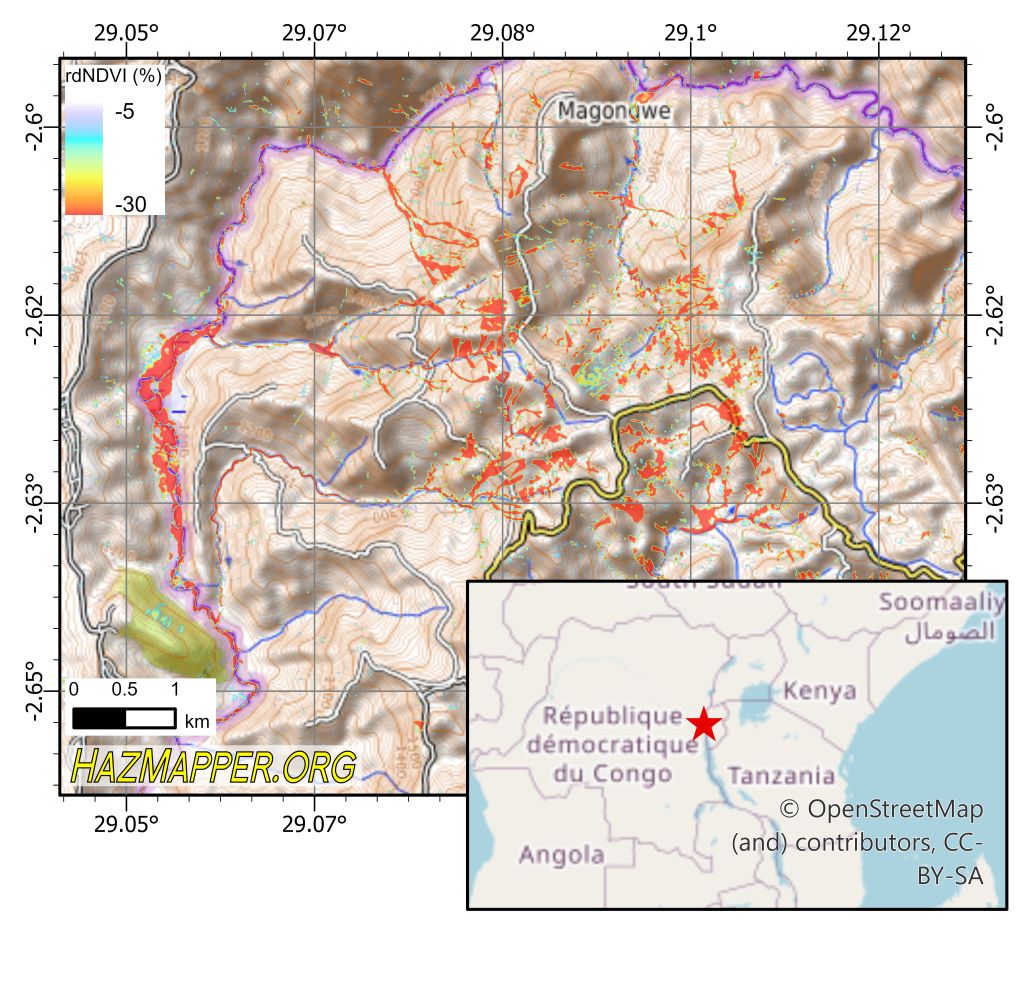
The steep hillslopes of the eastern African nation are heavily vegetated. We can get a good idea for where impacts were most severe by identifying loss in this vegetation across the December 4-5 storms. The region shown below is the most heavily concentrated region of hillslope movements. Reds and yellows represent the most severe vegetation loss.
At HazMapper, we are focusing on identifying loss in vegetation as a proxy for hillslope movements because it is so easy to interpret! See the images below, where we compare color satellite images from before and after the event. Then check out the loss in vegetation metric (“rdNDVI”) shown on the right panel. By applying a color scale to the rdNDVI data from HazMapper that only represents vegetation loss, we can quickly identify the fresh mass wasting scars. Which image directs your eyes to the debris flows faster, the post-event color image (center), or the HazMapper-rdNDVI map (right)?

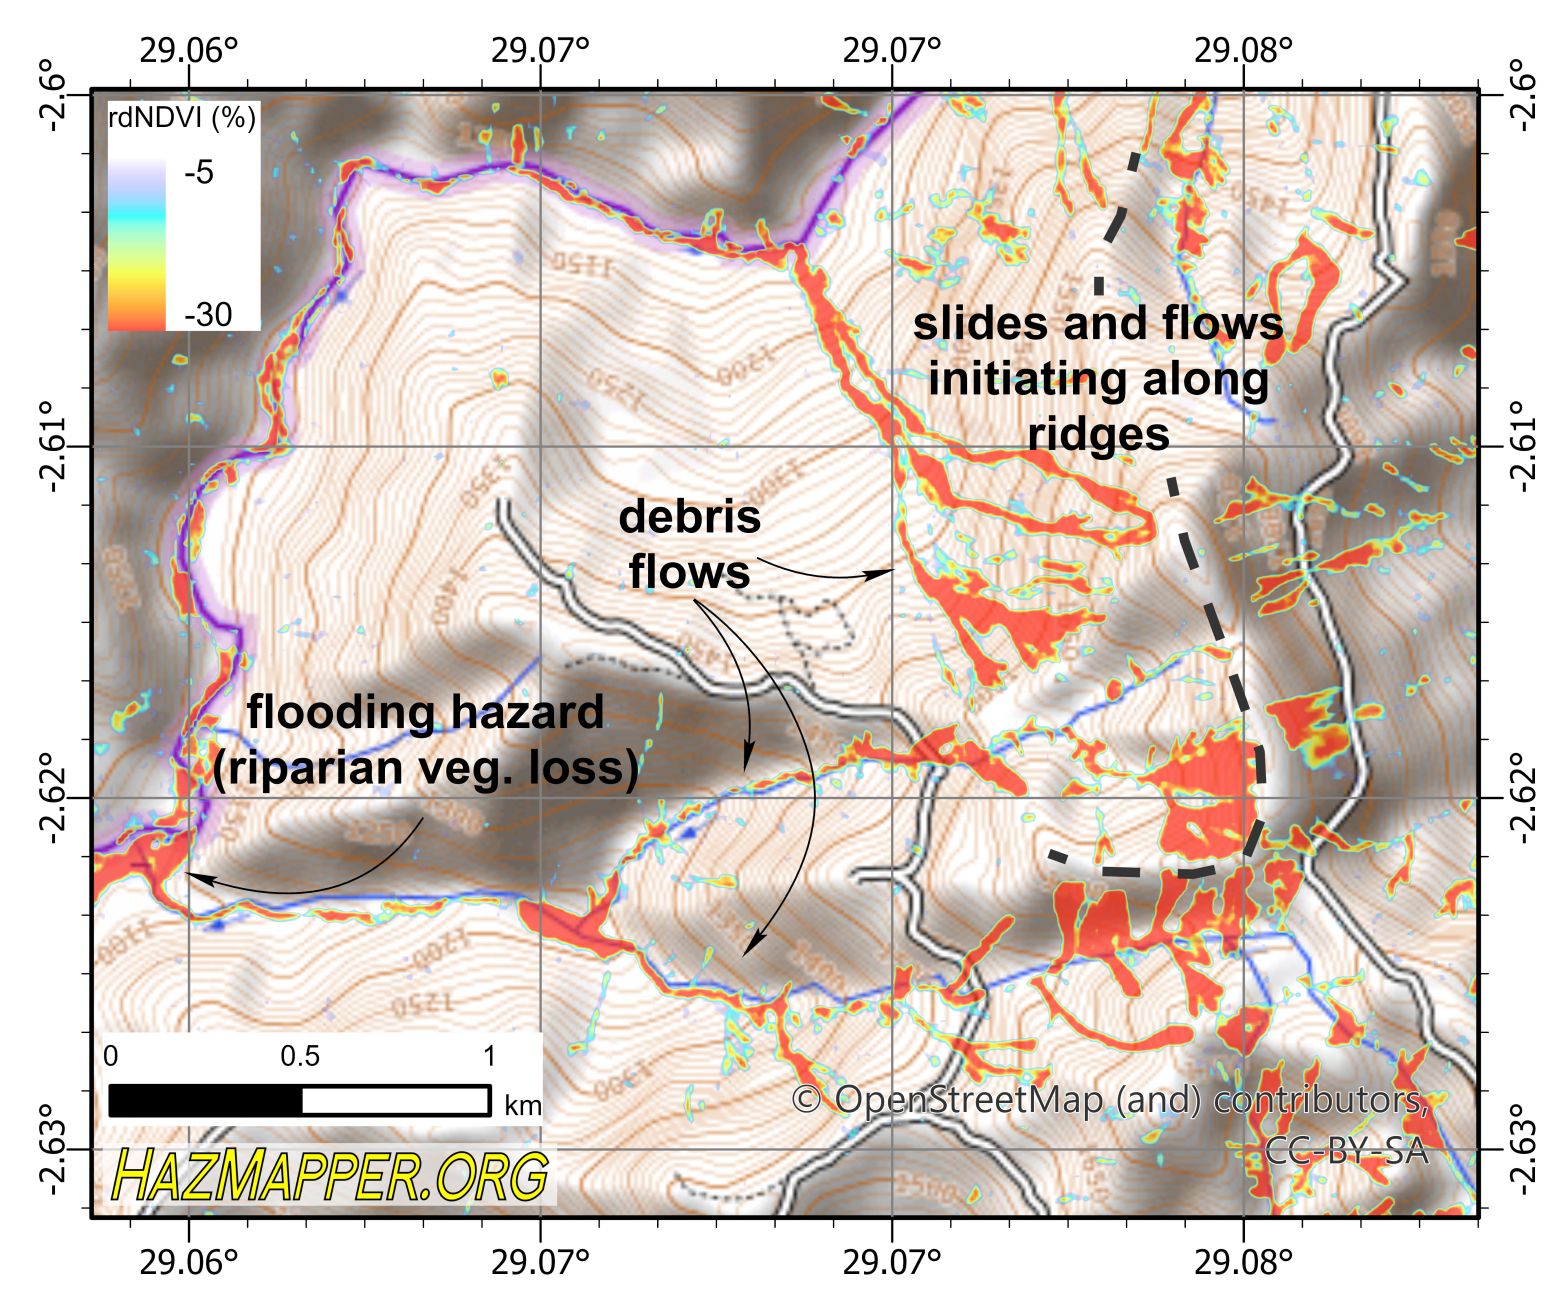
Zooming in, we can see some interesting but expected detail regarding the Burundi event. Shallow soil-driven landslides likely initiated near ridge crests of steep slopes. These small landslides can mobilize into large and dangerous debris flows, which is exactly what happened here. You can see the debris flows coalesce, bringing more water, debris, and energy downslope. Once the flows move off of the steepest mountain terrain, they begin to slow down, deposit a lot of the “debris” they’ve been carrying like rocks, trees, and sediment, and start to transition to pure flooding hazards. We can see these phases in the rdNDVI data:

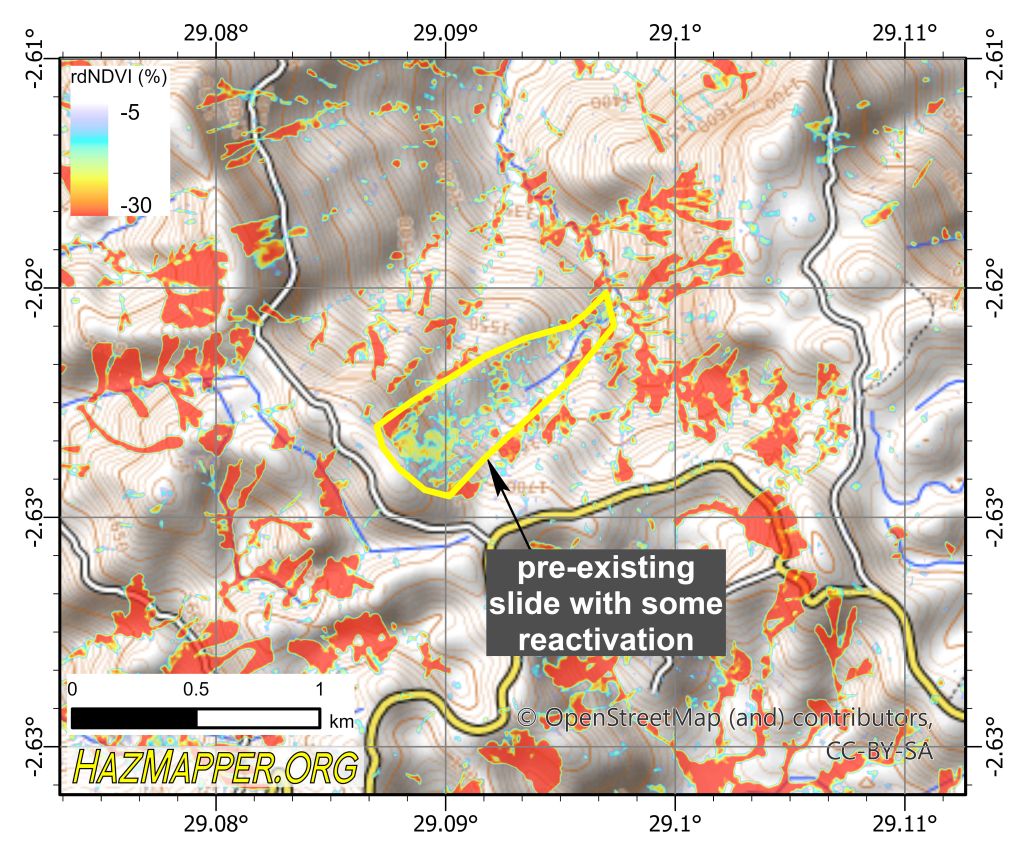
Another advantage of the vegetation loss metric is that we can see exactly what occurred at locations of previous mass wasting. Back on the Figure 2 pre-event panel (left), you may have noticed a large existing landslide in the center of the scene. Across the December 4-5 event, we can see some cool colors inside this pre-existing feature, meaning what little vegetation had re-grown since the initial landslide likely failed. However, if the whole mass slid, we would expect a large loss of vegetation at the bottom of the slide (“toe”), which is not observed. This indicates that there was probably some reactivation of sliding on this feature, but not a full failure!
This post has provided a very quick analysis of the 2019 Burundi mass wasting event. All of the data used in this analysis is completely open-access. Our goal with this project is to build open-access tools that can be used by anyone, anywhere, to rapidly assess natural hazard impacts or to use for researching historical events. We did not do any post-processing to the data export from HazMapper.
We’ll continue showing examples of what is capable with the HazMapper platform until we can finally release it! Peer-review underway, stay tuned and thanks for reading.
– Corey Scheip & Karl Wegmann | Geomorphology @ NC State University